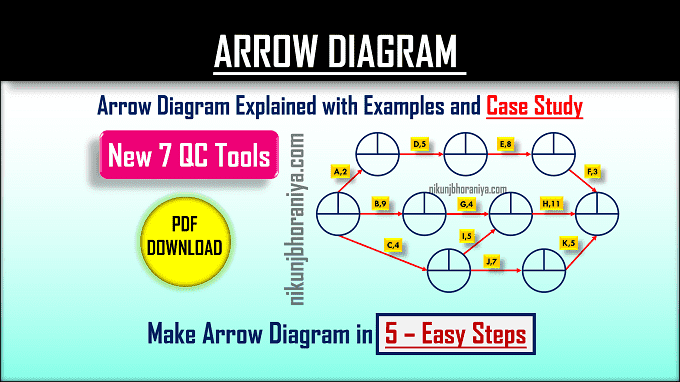
What is an Arrow Diagram?
→ An arrow diagram is used to decide the best sequence of a process or event. In this method, the activities are indicated by arrows.
→ This tool is used to decide the critical path.
→ Arrow Diagram is one of the most important parts of New 7 QC Tools (Seven Management and Planning Tools).
→ It helps us for preparing the best schedule for our project.
→ We can use this tool to identify the problems and provide the optimal and feasible solution.
👉 Download Arrow Diagram with Example PDF File
When we can use an Arrow Diagram?
→ We can use this tool - When we have a complex_project or process and we need to make scheduling and monitoring those tasks.
→ Arrow_Diagram is used when we have a surety about the sequence and time taken by all steps of the project or process.
→ If the scheduling of the_project is critical, and if we have a significant advantage of early_project completion or if the_project is late then we have a severe impact at that time we can use Arrow_Diagram.
Different Names of Arrow Diagram
- Activity on Arrow Diagram,
- Activity Network Diagram,
- Network Diagram,
- Activity Chart,
- Node Diagram,
- CPM (Critical Path Method),
- Network Operations,
Components of Arrow Diagram [CPM Method]
→ The Main Elements of the Arrow Diagram are mentioned below
→ A single arrow represents an activity to be performed.
→ The tail of the arrow shows the start of the activity and the head of the arrow shows the end of the activity.
→ The length of the arrow shows the duration of the activity.
→ The most common words that we use in the CPM_Method are explained below.
➨ Float (slack): The float or slack is the amount of time for that the activity can be delayed without the project delay.
➨ Crashing: The crashing is the reduction in the duration of the_project.
➨ Critical_Activity: It is the activity with zero floats.
➨ Activity: The_activity represents the task and also shown by the arrow symbol.
➨ Dummy_Activity: A dummy_activity is represented by a dotted arrow and does not consume any time & resource.
➨ Critical_Path: A Critical_Path is the sequence of critical activities that form a continuous path between the start of a project and the completion of the project
➨ Forward Pass: The early start_time and early finish_time calculated by moving forward through the
network.
➨ Backward Pass: The latest start_time and latest finish_time calculated by moving backward through the network.
➨ Float_activity: It is the difference between its earliest start_time and latest start_time or earliest finish_time and latest finish_time.
Example of Arrow Diagram
→ Refer to the below simple example of the arrow diagram


إرسال تعليق