What is the Process Capability Study?
→ Process Capability is a statistical measurement of a process’s ability to manufacture parts within the specification consistently.→ It is a statistical tool to measure the variability of the_process and it is a part of Statistical_Process Control.
→ Let we understand this concept with the help of a simple example
→ In simple language, the process is a sequence of interdependent steps that consume resources and convert the inputs into outputs.
→ Each step adds value to achieve the desired output.
→ All processes have a certain amount of variation and this variation cannot be eliminated.
→ We can monitor it, measure it, reduce and control it.
→ For Example, if we want to make a cup of tea, then our inputs are tea and water. Our operation step includes turning on the tea maker, measuring and adding the tea and water and our output is a cup of tea. The variation can occur in the amount of tea or water quantity during the operation and the performance of the tea maker. Not every cup of tea is exactly the same but if we control the measurements then it could be approximately the same. So with the help of a suitable measuring instrument, we can get a more reliable output.
→ Our processes can be capable of manufacturing an acceptable product on a consistent basis if we maintain the capability.
→ In Six Sigma Projects or any other quality improvement project, this tool is very useful for an estimate of the capability.
➨ Various Indexes for Process_Capability Measurement
⇢ (1) Cp - Potential_Capability
⇢ (2) Cpk - Actual_Capability during the production
→ Both are used with variable or continuous data and it shows how our process is capable and either meets our specifications or not?
→ Both are very important tools for calculating the initial and ongoing processes & parts capability.
Why Measure Process Capability:
→ In our business, the reduction of waste and providing quality products are paramount if we want to survive in the market and make a strong presence even if in cut-throat competition.→ Waste exists in various forms in operation steps.
→ With the help of implementing the SPC, we can easily collect and analyze the data and predict the performance of the running processes. Also, take necessary actions if needed.
→ By effectively using this tool, we can reduce scrap, improve product quality and consistency, and lower the cost to manufacture, and reduce the cost of poor quality.
How to calculate process capability?
Four Steps for Process Capability Study with Excel Template
- Fill basic details in Excel_template
- Define subgroup size & frequency of data collection
- Collect the data and put it into Excel_template
- Interpret the graph pattern and Capability Index value.
Step 1: Fill basic details in Excel template
→ Define the parameter for study and mention Part Name, Part Number, Tolerance band, Machine name, Date, etc. in the SPC Excel_template.→ We will write down all the details in the SPC Excel_template.
Step 2: Define subgroup size & frequency of data collection
→ Define the sample size “n”.→ We can take 2,3,4...,n samples in each subgroup.
→ Usually, four or five are common sample sizes.
→ We will take 5 samples in each subgroup.
→ We can define the frequency of sample checking like...5 samples in every 30 minutes or 5 samples in every 60 minutes, etc...
→ For, X-bar and R chart sample size should be 9 or less.
→ Also, determine the frequency of sample measurement.
→ We will collect 100 measurements in a subgroup size of 5 samples.
→ So we have to take a reading 20 times.
→ Then we will calculate the average value and range for each of the 20 subgroups having 5 samples in each.f
→ The range is the difference between the highest and lowest value in each set of 5 sample measurements.
→ In this case, we will take 5 samples every 60 minutes.
→ We will collect data as per our defined subgroup and frequency and put in an excel template.
Process Capability Formula:
Step 3: Collect the data and put into Excel template
→ The Upper Control Limits (UCL) and Lower Control Limits (LCL) will be calculated.→ X-bar and X-double bar (the average of the averages), which is represented on the X- bar chart by a solid centerline are also calculated.
→ Find out the average of the sample ranges or “R” values it is called R-bar
→ The value of R-bar is the centerline of the Range chart.
➨ The formula of Cpk Calculation.
⇢ Standard Deviation (𝞼) = R bar/d2
⇢ Cp = (Upper limit - Lower limit)/6𝞼
⇢ CPU = (Upper limit - X double bar)/3𝞂
⇢ CPL = (X double bar - Lower limit)/3𝞂
⇢ Cpk = Min of (CPU & CPL)
⇢ The control limits are not defined in drawing or it is not set by the engineer.
⇢ It is derived from the data.
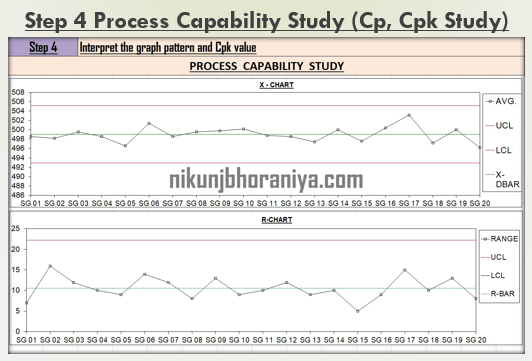
Step 4: Interpret the graph pattern and Capability Index value.
→ In this step, we will interpret the index value and graph pattern.👉 Read this for Control Chart Rules, Patterns, and Interpretation with examples
→ Check for the special causes, is it available or not?
→ If special causes are available then take necessary action.
Interpretation of Cpk value:
→ This study will give the outcome of the Cpk value.→ It provides an indication of the ability of a process to consistently provide an output that is within required specifications.
➨ There are four different cases of the process are mentioned below:
⇢ (1) Cpk <1.00 or =1 then it is poor and it is not capable.
⇢ (2) 1.00< Cpk <1.67 then it is fair and conditionally acceptable.
⇢ (3) Cpk >1.67 then it is excellent and capable)
⇢ (4) Cpk = 2 for a very excellent (i.e. 6-sigma process)
👉 See Also:


Thanks sir for very important topic
ردحذفYou are welcome!!!
حذفWell explained thanks
ردحذفYou are most welcome
حذفVery important info but not cleared how the values of D2 A2 calc
ردحذفThe value of D2, A2 is depends on the sample size its a standard value that we can take from the table.
حذفIs it possible to format cells to display more precision on decimals? Need to display 2 digits after decimal
ردحذفIt appears the cell formatting is locked to be able to increase this. This is an excellent tool thank you for sharing!
حذفCurrently we are working on that we will share update on that thanks for sharing.
حذفHow A2 & D2 value are calculated from the table??
ردحذفBoth are constants that is depends on the sub group size.
حذفI hope I have answered your query.
Thanks!!!
Hello Nikunj Ji,
ردحذفcan you please explain me how did you calculate n, d2, A2, D4 for 5 samples.
Thanks,
Sridhar
Hi Thanks for your query.
حذفAll those are the constant value and we can easily take it from standard table and basis on the subgroup size.
I hope it is clear to you!!!
Thanks
حذفHello Nikunj Ji,
ردحذفcan you post Pp & Ppk as well.
Thanks,
Sridhar
Hi Sridhar thanks for you suggesting we will definitely share that.
حذفThanks!!!
Hi there, my Excel doesn't have SPC tool. Is there an Excel version for the regular one?
ردحذفYes you can easily download that from our website!!!
حذفVery elaborate work
ردحذفThanks!!!
حذفCan you briefly explain difference between pp/ppk and cp/cpk. Also if you can show some example
ردحذفThanks for the Suggestion we will work on that.
حذفWhat is the password ?? In this file is protected..
ردحذفYou can reach us at: contact@nikunjbhoraniya.com
حذفWhy D3=0 for R chart
ردحذفD3 is depends on the subgroup size. In our example subgroup is 5. you can visit our GRR Study article for the all constant value table. Thanks!!!
حذفCan you please provide the password to unprotect this workbook? I would like to change some formatting
ردحذفHi You can reach us at: contact@nikunjbhoraniya.com
حذفDowenload the templete, right click on the tab, choose the function ; unprotect the exceel shee.
حذفhow to unprotect excelt fle
ردحذفYou can reach us at contact@nikunjbhoraniya.com
حذفopen file then save to xls file
حذفHi, thank you for this tutorial. Do we need to pay for a full access to the template? I am trying to use it using our process specs. Thank you
ردحذفIt's absolutely free for use. You can reach us at contact@nikunjbhoraniya.com
حذفإرسال تعليق