Control Chart Rules, Patterns, and Interpretation
➝ Control Chart Rules, Patterns, and Interpretation are helping us to identify the special cause of variation in the process.➝ By referring to these 8 rules, we can identify and eliminate the cause of variation and make our operation smooth.
➝ It is a statistical tool used to differentiate between process variation resulting from a common cause & special cause.
👉 Check this article for, Complete understanding of the Fundamentals of what is Control Chart? | Types of the Control Chart | Make your chart in easy 8 steps.
Different zones in the control chart
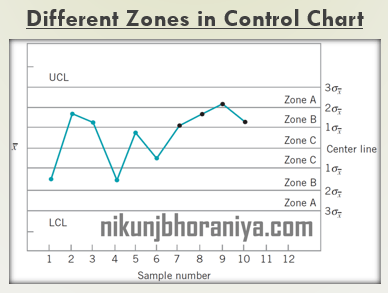
➝ Now, first of all, we define the zone for understanding the Control Chart Rules.➝ Please show the below picture for a clear understanding of UCL, LCL, Centreline, and different Zone A, Zone B, and Zone C.
➝ Each zone has a distance of one sigma.
➝ From the center line add one sigma for each zone.
Eight Control Chart Rules
➝ The Eight different rules are mentioned below (Source: AIAG – (SPC) 2nd Edition)- One or More points are more than 3𝝈 from the center-line
- 7_points in a row on the same side of the center
- 6_points in a row increasing or decreasing steadily
- 14_points continuously alternating up and down
- 2 out of 3 consecutive points > 2𝝈 from the center-line (same_side)
- 4 out of 5 consecutive points > 1𝝈 limit from the center-line (same_side)
- 15_points in a row within 1𝝈 of the center-line (either_side)
- A run of 8 consecutive points > 1𝝈 from the center-line (either_side)
Rule 1: One or More points are > 3𝝈 from the centerline
→ It is also called a point beyond the central line.→ Sometimes, Rule 1 also known as a large shift from the average.
→ If we can get any point beyond the control line then the special cause is available.
➨ Possible Causes:
⇢ The new person doing the job
⇢ Wrong setup
⇢ Measurement error
⇢ Operation step skipped or not completed
⇢ Power failure
⇢ Equipment breakdown
Rule 2: 7_points in a row on the same side of the center
→ It is known as a Small shift from the average.→ If we get continuously 7_points on the same side of the centerline then the special cause is available in the process.
➨ Possible Causes:
⇢ Raw material change
⇢ Change in work instruction
⇢ Different measurement devices/calibration
⇢ Different shift
⇢ A person gains greater skills in doing the job
⇢ Change in the maintenance program
⇢ Change in the setup procedure
Rule 3: 6_points in a row steadily increasing or decreasing
→ It is known as a trend pattern.→ If we get a pattern of 6_points continuously in increasing order or decreasing order then the special cause is available in the process
➨ Possible Causes:
⇢ Tooling wear
⇢ Temperature effects (cooling, heating)
Rule 4: 14_points continuously alternating up and down
→ This is also known as an overcontrol pattern→ If we get 14 points in a row up and down then the special cause is available in the process.
➨ Possible Causes:
⇢ Tampering by the operator
⇢ Alternating raw materials
Rule 5: 2 out of 3 consecutive points > 2𝝈 (same_side)
→ It is also known as a large shift from the average.→ If we get 2_points out of consecutive 3_points present in >2-sigma distance from the center-line on the same side then the special cause is present in the process.
→ In other words, 2 out of 3 consecutive points are present in zone A (same side of the center-line).
➨ Possible Causes:
⇢ The new person doing the job
⇢ Wrong setup
⇢ Measurement error
⇢ Operation step skipped or not completed
⇢ Power failure
⇢ Equipment breakdown
Rule 6: 4 out of 5 consecutive points > 1𝝈 (same side)
→ It is known as a Small shift from the average.→ If we get 4_points out of consecutive 5_points present in >1-sigma distance from the centerline on the same side then the special cause is present in the process.
→ In other words, 4 out of 5 consecutive points are present in Zone B or beyond (same side of the centerline).
➨ Possible Causes:
⇢ Raw material change
⇢ Change in work instruction
⇢ Different measurement devices/calibration
⇢ Different shift
⇢ A person gains greater skills in doing the job
⇢ Change in the maintenance program
⇢ Change in the setup procedure
Rule 7: 15_points in a row within 1𝝈 (either side)
→ This is also known as the stratification nature of the pattern.→ If we get 15_points in a row within 1 sigma of the centerline or within zone C (any side of the central line) then the special cause is available.
➨ Possible Causes:
⇢ Data mixed with more than one process.
⇢ Mixed data of more than one shift, machines, or raw materials
Rule 8: A run of 8 consecutive points > 1𝝈 (either side)
→ This is also known as a mixture property of pattern.→ If we get 8 consecutive points > 1 sigma from the centerline (either side) then the special cause is available.
→ In other words, 8 consecutive points with no points available in zone C (any side of the centerline).
➨ Possible Causes:
⇢ Data mixed with more than one process.
⇢ Mixed data of more than one shift, machines, or raw materials
Summary of Control Chart Rules:
→ It is very difficult to list out all possible special causes for each pattern.→ Because special_causes are very dependent on the type of process.
→ Manufacturing processes have different issues and service-related processes have different issues.
→ For, understanding purposes, some possible causes which are responsible for the special_cause of variation and identified by chart pattern are mentioned in the below table.
👉 See Also:


👍
ردحذفThanks!!!
حذفNice structure and content
ردحذفThank you very much for your appreciation
حذفإرسال تعليق